 To measure marketing effectiveness, there are gobs of metrics you can, and should, use – leads, website traffic and conversions, social connections and engagement… the list goes on.
But most of these metrics are to help you, the logistics marketer, improve. Few marketing metrics mean a whole lot to CEOs.
They want to know whether their investment in marketing is contributing to top-line growth and whether the results justify the marketing budget expense. Giving them these answers requires metrics that link marketing efforts with actual sales results.
Following are some of my favorite ways to demonstrate marketing’s bottom line return:
Percent of total pipeline contributed by marketing
According to Hernan Vera of Sales Outcomes, best practice performance for B2B marketing organizations is 25%. So if the sales pipeline is $10 million, at leading logistics businesses marketing leads should contribute $2.5 million of this potential revenue.
An accurate metric requires that you assign a lead source for every lead – at least those that become opportunities. Hopefully you’ve linked your website to your CRM so that the “lead source” field is automatically populated with the correct choice, such as “contact us form.” For those leads that require choosing a lead source, you’ll want to make sure the sales team understands the importance of completing the field (I suggest you make it mandatory) and doing it accurately. All inbound inquiries – call or email – should be designated as a marketing lead since something triggered the prospect to reach out.
If you have the lead source data, it should be fairly easy to calculate this metric, either manually or by creating a report within your CRM.
Pipeline by Lead Source
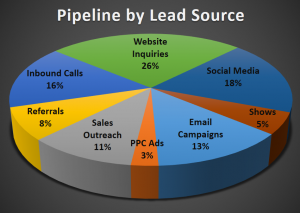 This data provides a more detailed picture of the source of pipeline opportunities in order to measure marketing effectiveness. Here, you can get granular by breaking out each lead source separately, or you can group leads into broad categories like marketing, referrals, and sales-generated. Here is an example of a pipeline by lead source report.
Customer Acquisition Cost (CAC)
This one leaks over to sales and includes all costs – sales and marketing salaries, advertising expenses, commissions, plus overhead. You add up all these annual costs and DIVIDE the total by the number of new customers in that year. If you spent $1 million on Sales and Marketing and added 25 new customers, your CAC is $40,000.
This is a simple metric that CEOs can easily understand. They typically have a good handle on what a new customer is worth to the company, so CAC provides a good frame of reference for decision making.
To the extent that sales and marketing resources are involved in retaining and servicing existing customers, this metric gets a little tricky since the equation does not factor in the value of existing customers. In these cases, if it’s possible to segregate out the marketing and sales costs aimed at new sales, that is best. Otherwise, the CAC may be inflated.
Ratio of Customer Lifetime Value to Customer Acquisition Cost (CLV:CAC)
This gets at marketing ROI and how to measure marketing effectiveness from a bottom-line perspective. To determine customer lifetime value (CLV), first MULTIPLY the expected yearly revenue from new accounts by the average number of years a customer will stay, then MULTIPLY this total revenue by your company’s operating margin percent (how much revenue is left over after all the variable or operating costs have been paid). Not sure about the operating margin of your logistics business? Ask your CFO.
If the combined lifetime revenue of the new customers you signed last year is $10 million and your operating profit margin is 15%, then your CLV for these new customers is $1.5 million.
- If your CAC last year was also $1.5 million, then your CLV:CAC ratio is 1:1
- If your CAC was $500,000, then your CLV:CAC ratio is 3:1
- If your second number is higher than your first, that’s bad.
Months to Payback
This metric is calculated by DIVIDING the CAC by the margin-adjusted revenue per month.
First, determine your average monthly revenue from a new customer (average out the estimated annual revenue for new customers added last year to come up with an average revenue per new customer, then DIVIDE BY 12). If that monthly figure is $50,000 and your CAC is $500,000, then your “months to payback” is 10. Your CEO will want it to be under 12 months.
Some Other Metrics to Measure Marketing Effectiveness
Here are other metrics you’ll want to understand. If you don’t know the answer to these questions, spend a day digging into your marketing and sales data to figure them out.
- Cost of a lead. This is simply the total marketing communications costs (advertising, email campaigns, etc., but not salaries and overhead) DIVIDED BY the number of leads in a given period. Since many of the “leads” that come in via your inbound marketing efforts are not legitimate (for instance, students or competitors downloading white papers), you may choose to define leads as all leads or just qualified leads, which grabs the leads figure after a vetting process
- Value of a lead. The lifetime value of new customers (CLV) signed in a particular period divided by the total number of leads during that same period.
- Lead to Opportunity conversion rate. Expressed as a percentage, this is the total number of sales opportunities in a given period (genuine quoting opportunities) DIVIDED BY the number of leads MULTIPLIED BY 100.
When you know what the value of a lead is, you can determine how many leads you need each month to sustain your business and how much you should pay for advertising. This is true whether you are using pay-per-click (PPC) or any offline advertising like mailers or print ads.
CRM systems are key
Without a solid CRM system and process, it will be difficult to obtain some of the metrics we are discussing. Many logistics businesses use the very robust Salesforce.com and HubSpot now offers a free CRM for companies with basic CRM needs. There are many other moderately priced CRMs out there. But just having a CRM is certainly no guarantee of success. Processes and procedures need to be mapped out and the sales and marketing team must be disciplined about following them.
Not everything can be measured!
As much as we try to make marketing accountable through careful measurement, the reality is that there is value that cannot be measured. Examples:
- After reading a trade magazine feature story on your company’s solution (a story your PR efforts helped to place), a consultant that knows your CEO calls him and suggests he contact a company that is looking for precisely that solution (lead source: referral).
- One of your sales people shares a marketing-created case study with a prospect, who is intrigued by the case and, eventually, becomes a customer (lead source: sales).
- A manufacturer in desperate need of overflow space googles “food grade warehouse in CITY, ” finds your company and stops by the warehouse to talk to your DC manager (lead source: who knows?!).
Marketing helped to find and close each of the above-described sales, but metrics reports may indicate no marketing involvement. For that reason, it’s important that CEOs understand the broader impact of branding and Marketing’s overall support of the sales process.
By taking steps to measure marketing effectiveness, you raise your credibility with the CEO and give him/her, and yourself, useful data to make decisions. But there are no black and white formulas that can calculate, with certainty, the full value of Marketing’s contribution.
Free eBook:
 Logistics Buyers Reveal How to Get, and Keep, Their Attention
Our new 2016 eBook summarizes the results of our survey of buyers of logistics services, including verbatim comments that take you inside the minds of your prospects and how they feel about the many marketing and sales pitches they field daily.